Stress Combination and their Interactions in Plants (SCIP) Database
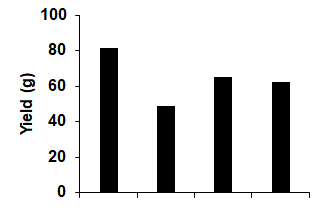
The interactive view represented below shows the net impact of stress combinations on plant performance. Positive (green colour or its graded shade) and negative (red colour or its graded shade) interactions indicate that the plant parameter is less and more affected under combined stress as compared to individual stresses, respectively. Once the user selects stress 1 from the drop-down menu, automatically stress 2 drop-down menus will show the list of stresses that are reported interaction with stress 1. Option to choose stress 3 is also provided if such a combination is reported in the literature. Once stresses are selected user can choose the plant species, and after that, the outcome will be displayed. The display will show the plant species name, stress combination, whether the interaction is positive or negative, along with the number of studies reported the trend and the measured parameter, which was considered to conclude. Finally, one representative graph for one of the listed parameters showing the actual values under different stress treatments, along with control, will also be displayed. 1) Red-color icon indicates the outcome of combined stress is depicted as ‘negative’ and parameter under study is affected under stress. 2) Green-color icon indicates parameters are not affected under combined stress conditions. 3) Gray-color icon indicates studies in no signficant affect of combined stress could be ascertained on the studied parameter compared to individual stresses.
Choose the combination and plant species:
Outcome/Result
Net impact of combined stress
For details/other parameters, visit the phenome section of the SCIPdb
@SCIPdb 2022